
Practical AI for supply chain and operations, starting with your data
Analysts expect AI agents to become common in supply chain software, but they also advise starting with low-risk, measurable use cases. Our AI support for manufacturers starts there: clean the data that matters, pilot one use case, and keep a person in the loop. Free 30-minute call first. We agree the scope with you before any work starts.
Who this is for
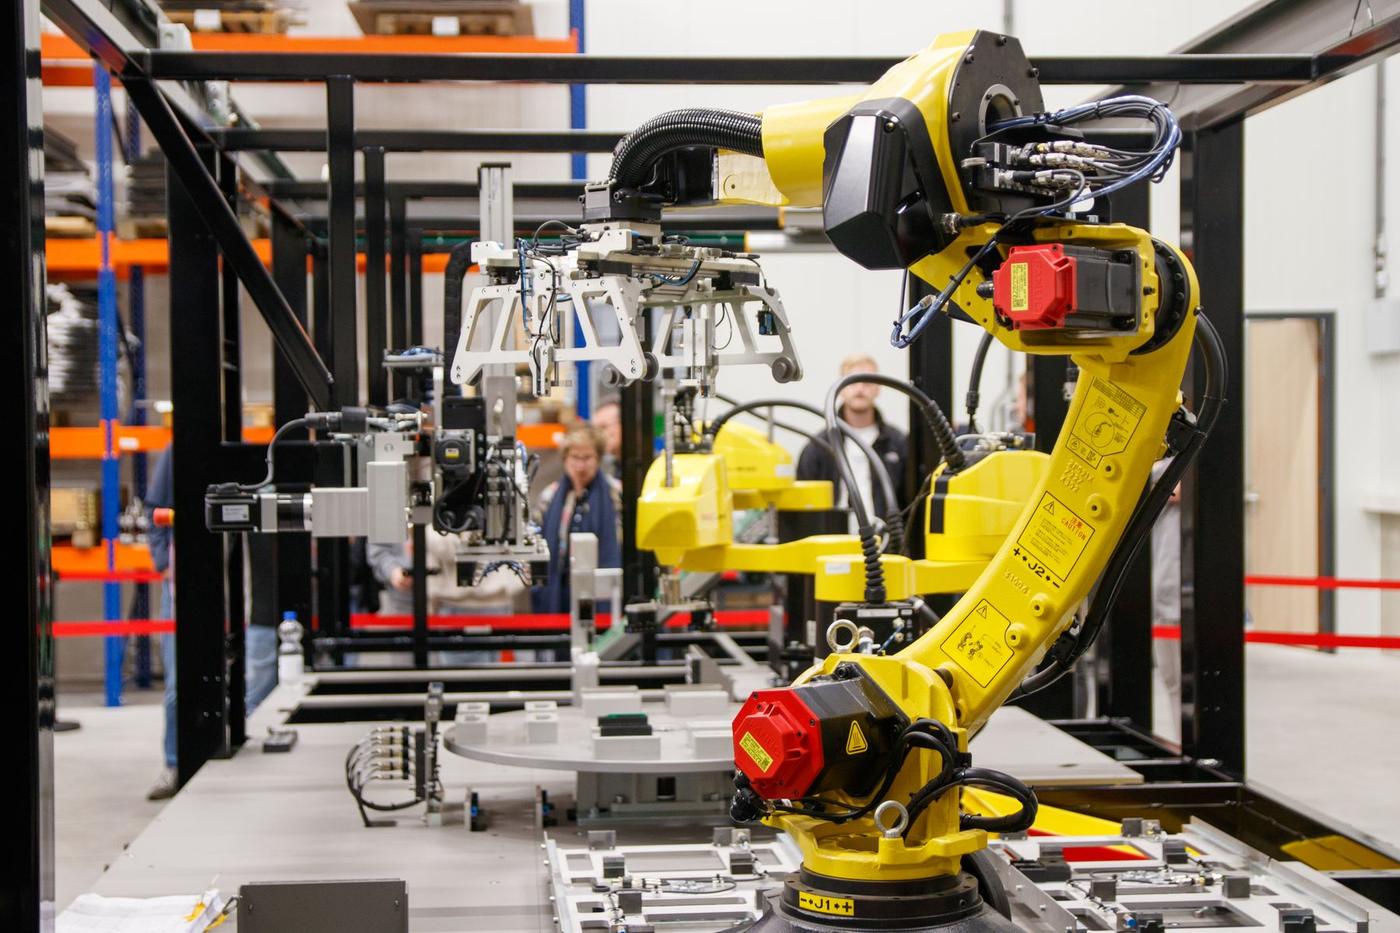
This work is for manufacturers and growing businesses that have data in ERP systems, spreadsheets, machines, quality systems or shared folders but lack a trusted decision view. It supports leaders who want better visibility before choosing a platform, a dashboard or an automation investment.
- Operations and finance teams reconciling different versions of the same KPI.
- Plants that need a role-based KPI dashboard for daily or weekly decisions.
- Planners who want a statistical baseline to review and adjust.
- Teams exploring practical AI or workflow automation with clear human ownership.
Signs you need it
- Reports take too long to assemble and still prompt basic data questions.
- Definitions for output, downtime, quality, inventory or service vary by team.
- Important exceptions are buried in email, spreadsheets or manual checks.
- AI ideas are discussed before the process, data, risk or owner is clear.

Practical AI starts with the work your team already does
Our AI consulting for manufacturers is deliberately unglamorous. Most useful AI work in a plant is cleaner item data, a forecast baseline a planner can challenge, fewer hours spent retyping purchase orders and a report that answers the question the first time.
We look at your orders, inventory, quality and supplier data, then pick one problem where a small pilot can show value, or show that it is not ready yet. That is a useful answer too.
- One named owner for every AI use case.
- A person reviews anything that goes to a customer, a supplier or the shop floor.
- No platform recommendation until the problem and the data are clear.
Our AI work sits alongside our operations and supply chain consulting, so the process and the data are improved together.
Services we offer
Use AI and data where they help, with a human owner. Each service is a defined piece of work. We start with a free call, and the scope is agreed with you before we start. Open a card to see deliverables and what we need from you.
AI use-case assessment
Pick the one problem where a small AI pilot makes sense.
For: Leaders exploring AI without a clear starting point.
Deliverables and what we need from you
Deliverables: Ranked use-case list, data and risk notes, recommended pilot
You provide: Process descriptions, sample reports, data access overview
AI forecasting prototype
Build a statistical forecast baseline planners can challenge.
For: Planners working from spreadsheets.
Deliverables and what we need from you
Deliverables: Prototype forecast, accuracy check against history, handover notes
You provide: Demand history by item, known promotions or events
Workflow automation
Reduce retyping and manual checks in repeated tasks.
For: Teams keying POs, reports or emails by hand.
Deliverables and what we need from you
Deliverables: Documented workflow, automated version, human review steps
You provide: Example documents, current steps, system access
AI policy and data readiness
Clean key data and set simple rules for AI use with your team.
For: Companies about to use AI assistants or analytics.
Deliverables and what we need from you
Deliverables: Data readiness checklist, cleanup plan, short AI-use policy draft
You provide: Data sources list, current policies, IT contact
Related: Statadventure Optimization Lab: planned AI software · Supply chain consulting · Procurement consulting · Free supply chain tools
See every service on the Services hub.
AI service packages
Eight ways we help US manufacturers and growing businesses use AI in a controlled way. Each starts with a free 30-minute call, and we agree the scope with you before any work starts. You can start with one service, and none of them requires replacing your ERP.
Readiness
AI readiness assessment
Who it is for: Leaders who are unsure where AI fits, or whether their data is ready for it.
What you get: A review of data, processes and risk, a short scorecard, and a ranked list of use cases marked ready now or not yet.
Typical first step: A 30-minute call, then a look at a sample of your ERP exports and the reports people rely on.
Planning
Demand forecasting pilots
Who it is for: Planners with at least 12 months of order history for a product family.
What you get: A statistical forecast compared with your current method on one product family, plus a forecast file or dashboard and an adoption plan.
Typical first step: Choose one product family and export its order history.
Inventory
Inventory and reorder optimization
Who it is for: Buyers and planners dealing with both stockouts and slow-moving stock.
What you get: A review of safety stock and reorder-point logic, a list of exceptions for planners to review, and written rules your team can maintain.
Typical first step: Classify items by value and demand pattern, then check lead-time data for the top items.
Back office
Document automation
Who it is for: Purchasing, shipping and accounts teams retyping POs, invoices, packing lists and supplier emails.
What you get: A mapped workflow, a tool that reads and drafts from those documents, a human approval step for exceptions, and a handover guide.
Typical first step: Collect a sample of recent documents and map the steps people take today.
Quality
Quality inspection and defect-detection scoping
Who it is for: Plants considering visual inspection or looking for patterns in defects and scrap.
What you get: A scoping study: defect types, available images and data, line constraints, success measures, build-or-buy options and a go or no-go view. This is scoping, not equipment installation.
Typical first step: Walk through your defect log and a few line photos with the quality lead.
Reporting
KPI dashboards and natural-language reporting
Who it is for: Operations and finance leaders who reconcile different versions of the same KPI.
What you get: Agreed KPI definitions, a role-based dashboard in a standard BI tool, and an option to ask plain-English questions of approved data with answers checked against source figures.
Typical first step: List the decisions the dashboard must support and who makes them.
Assistants
AI assistants with guardrails
Who it is for: Sales, operations and customer service teams answering the same questions again and again.
What you get: An assistant limited to approved documents and data, rules on what it may and may not answer, human approval for outgoing messages, and a test question set.
Typical first step: Pick one workflow, such as order-status questions or SOP lookups, and gather the approved source documents.
Governance
Staff training and AI policy
Who it is for: Owners and managers whose staff already use chat-style AI tools, with no written rules.
What you get: A short AI use policy (what data may be shared and who reviews output), an approved-tools list, a review checklist and a role-based training session. General guidance only, not legal advice.
Typical first step: Find out which AI tools people are already using and what information goes into them.
Our AI and data offerings
Defined pieces of work with named deliverables. Scope agreed before we start.
Planning Data Readiness Audit
A scorecard and fix-list before you spend on AI tools, for teams who want AI but doubt their data.
- Data quality scorecard for item master, BOMs, lead times and order history
- Prioritized fix plan
- “Ready now / not yet” use-case list
Demand Forecasting Pilot
Test a forecast on one product family against your current method. Best for firms with 12 or more months of order history.
- Data audit
- Baseline versus model comparison
- Forecast file or dashboard
- Adoption plan
Workflow Automation for Exceptions
Automate routine follow-ups and report refreshes with approval rules, for planners and buyers buried in expedite emails.
- Mapped workflow
- Automation build: alerts, PO follow-ups, report refresh
- Guardrails and approval rules
- Handover guide
KPI Cockpit
One view of orders, inventory, supplier lateness and risk alerts for firms with data in several systems.
- Dashboard
- Alert rules
- Data refresh process
AI-Assisted Work Instructions & Training
Capture know-how so new hires ramp faster. Delivered together with Operations.
- Digitized SOPs and troubleshooting guides
- A simple Q&A assistant on approved documents
- Training checklist
Landed-Cost & Tariff What-If Dashboard
Re-price faster when tariffs, freight or input costs move. A standalone offer with its own page. Not legal or customs advice.
Why now
Vendors and analysts are loud about AI, but the evidence points to starting small and fixing data first:
- Gartner said in March 2026 that current immaturity and data issues limit full automation to low-risk decisions for now.
- In Netstock’s 2026 survey of small and mid-size businesses, data integrity and security is the top AI concern at 39%.
- In PwC’s 2026 survey of 767 US operations and supply chain leaders at $100M+ companies, 73% agree data does not need to be perfect to drive value.
That is why every AI engagement here starts with the data and a named human owner.
What we do
Data readiness
Good AI and good dashboards depend on consistent, trustworthy data. A short KPI definition set and a source inventory solve more problems than a new platform.
Dashboards and BI
We build a KPI view that connects trusted definitions to a role, a decision, a cadence and an action, rather than presenting every available measure.
Demand forecasting support
We help planners work from a statistical baseline they can review, challenge and adjust, rather than a black box nobody can explain.
Workflow automation
We look for repetitive, low-risk steps where automation can help, with a human responsible for the result.
AI-assistant adoption
We help your team adopt AI assistants carefully, with clear boundaries on what information may be shared and who reviews the output.
AI use cases by function
Where AI tends to help a small or mid-size manufacturer, by team. These are examples to start a conversation, not a promise of results. Whether any of them fits depends on your data and your process.
Supply chain
- Forecast baselines for planners to review
- Reorder and stockout exception lists
- Supplier lateness and lead-time flags
- Plain-language summaries of shipment delays
Operations
- Downtime and scrap pattern reviews
- Questions answered from approved SOPs
- Shift hand-over and maintenance log summaries
- Defect-detection scoping
Finance
- PO, receipt and invoice matching support
- Draft variance commentary for review
- Inventory value, turns and carrying-cost tracking
- Landed-cost what-ifs when freight or duties change
Sales and customer service
- Order-status answers drawn from your own data
- Draft quote and RFQ replies with human approval
- Email sorting and routing
- An assistant for product and policy questions
How an AI project with us works
Four steps, each with a decision point. We start with a free 30-minute call, and the scope is agreed with you before any work starts.
1
Pick one problem
We choose a single, specific problem with a named owner and a measure you already track, such as forecast error on one product family or hours spent on one document type.
2
Check the data
We test a sample of your real data for gaps, inconsistent definitions and access issues, and tell you plainly if the use case is not ready.
3
Run a small pilot
We build the smallest version that can be tested against your current method, with a person reviewing the output and clear limits on what it may do.
4
Measure and roll out
We compare results with the starting point, document ownership and review steps, and roll out only what proved useful. If it did not, you know before spending more.
AI work follows the flow of your goods and your data
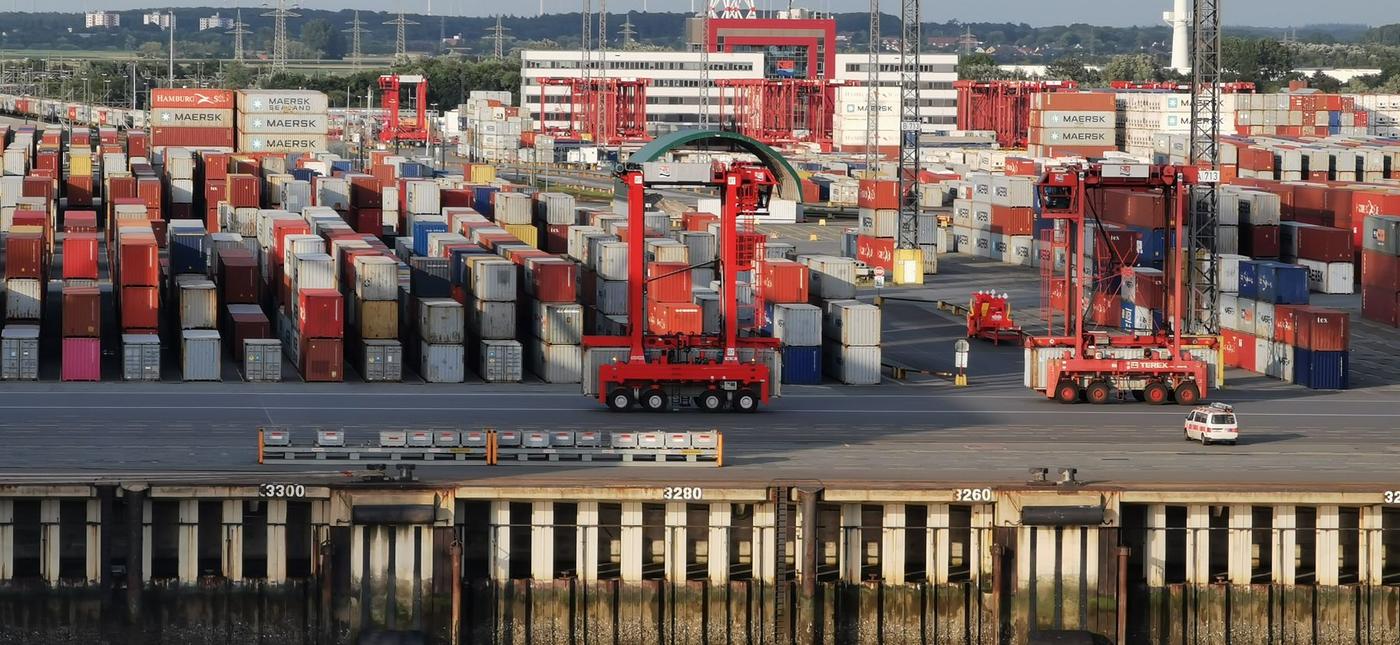
The data behind a useful AI project lives in the places your team already works: the warehouse, inbound freight, the plant and the reports on someone’s laptop.


Tools
We start from the ERP exports and spreadsheets you already have. Where a shared, refreshable view is needed, we build prototypes in standard BI tools such as Power BI or Tableau, and we recommend platforms only after the KPI definitions and data owners are clear.
How it works
1
Frame the decisions
We identify the people, meetings, questions and exceptions the data should support.
2
Audit the inputs
We review sources, definitions, refresh patterns, permissions and known quality issues.
3
Prototype
We design a dashboard view, forecast baseline or workflow prototype and review it with the people who will use it.
4
Plan adoption
We document ownership, validation, change needs and a practical next release.
A focused engagement is typically three to five weeks once scope, access and users are confirmed.
Typical outcomes
Goals include faster access to a shared KPI view, clearer metric ownership, better exception conversations and a more responsible path for BI and AI automation. No dashboard, forecast or automation guarantees a business result. Value depends on data quality, user adoption, process discipline and the decisions made from the information.
What AI can and cannot do for a plant
AI is a tool, and a narrow one. Here is the honest version.
AI can help with
- Find patterns in orders, downtime or quality records faster than a manual spreadsheet review.
- Draft a forecast baseline for a planner to review, challenge and adjust.
- Read, sort and extract data from documents and emails, and draft replies for a person to approve.
- Answer questions from approved SOPs, manuals and policies.
- Flag exceptions such as late suppliers, unusual consumption or missing data.
AI cannot
- Repair bad or missing data on its own. Poor inputs give poor outputs.
- Replace the judgement of planners, buyers, quality engineers and operators.
- Predict events that history does not contain, such as sudden tariff changes or supply shocks.
- Make safety-critical or compliance decisions unattended.
- Guarantee a business result. Value depends on data quality, adoption and process discipline.
That is why every project here has a human owner and a review step, and why we say so when a use case is not worth pursuing.
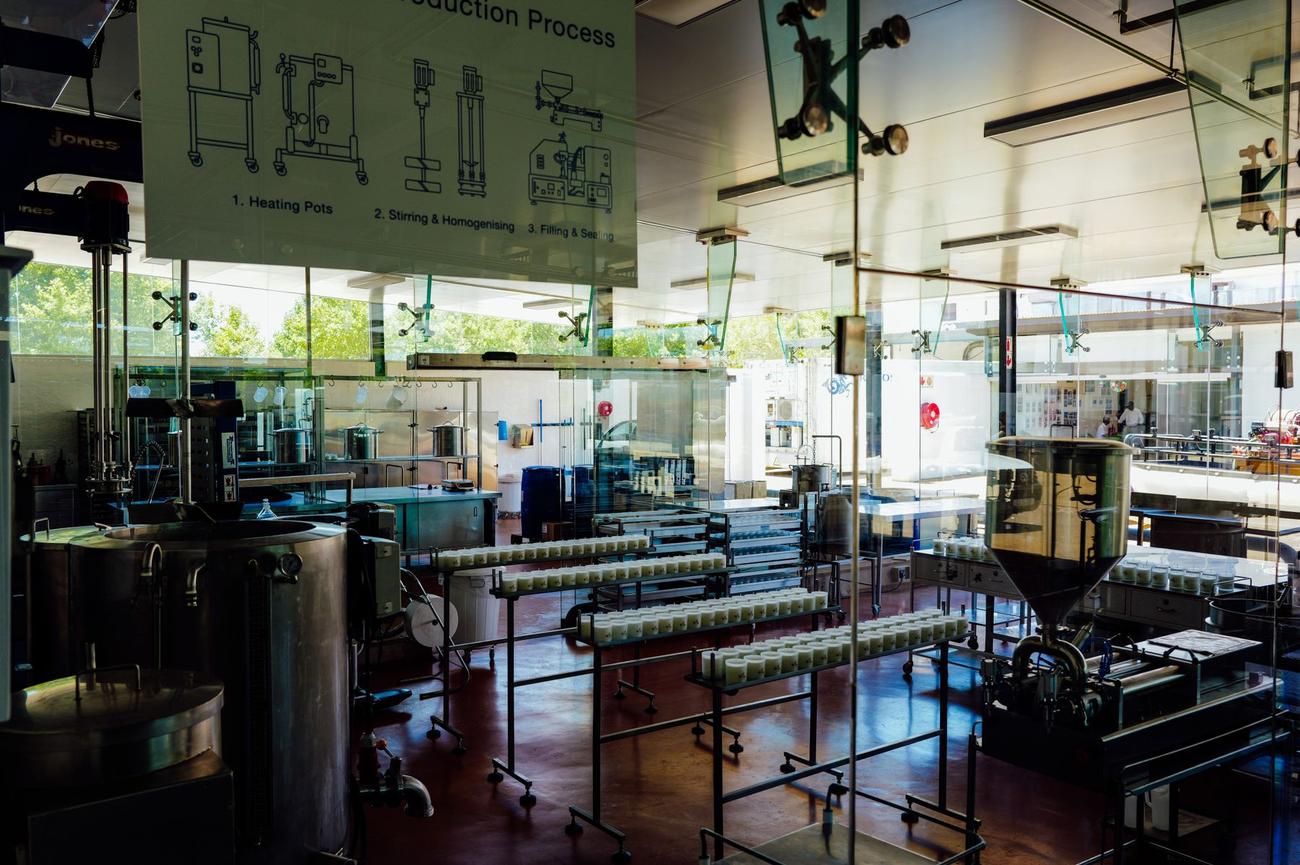
Watch: AI in manufacturing
Two videos from outside organizations for general background. They are not our content, and the views expressed are those of the speakers.
The Next Manufacturing Breakthrough: Human + AI Orchestration at Scale. Video by McKinsey & Company on YouTube.
AI-Driven Supply Chains: 3 Cases | MIT SCALE Webinar | English. Video by MIT Center for Transportation & Logistics on YouTube.
Common questions
Straight answers to the questions we hear most from manufacturers thinking about AI.
Where should a manufacturer start with AI?
Start with one specific problem that has a named owner and a measure you already track. Good first candidates are a forecast for one product family, a document type your team retypes, or a report that takes too long to assemble. A free 30-minute call is a good way to pick one.
Do we need to clean up our data first?
Your data does not need to be perfect, but it does need to be good enough for the decision at hand. We check a sample of your real data first, fix the gaps that matter and tell you plainly if a use case is not ready.
Can you work with our ERP and spreadsheets?
Yes. We usually start from the ERP exports and spreadsheets you already have. We do not replace your ERP, and we only suggest new platforms once the problem, the KPI definitions and the data owners are clear.
Will AI replace our planners, buyers or operators?
No. Our work is designed so that a named person stays responsible for each result. AI handles repetitive steps and drafts, and your people review exceptions, approve anything that goes outside the company and make the final call.
Is it safe to use company data with AI tools?
It depends on the tool, its settings and the data involved. We help you set rules on what information may be shared, which tools are approved and who reviews the output. Check vendor terms and your customer confidentiality obligations, and take legal advice where needed. Our guidance is not legal advice.
How is an AI project scoped and priced?
After the free 30-minute call, we agree a defined scope and the price with you in writing before any work starts. We do not publish prices on this page because they depend on your data, systems and the number of users involved.
Frequently asked questions
Is AI required?
No. We consider AI only where it solves a defined problem and can be governed. A simpler report or workflow may be the better choice.
Do you replace our ERP or BI platform?
No. We start with decisions and data reality, then help define the smallest useful improvement and platform requirements if a change is justified.
Can you work with spreadsheets?
Yes. Spreadsheets can be a useful starting point when their definitions, ownership and refresh expectations are explicit.
Is our data good enough?
Often it is enough to start. We identify the gaps and fix the ones that matter for the decision first. Small or messy data sets may not support complex models, and we will say so.
Will the forecast pilot beat our current method?
We cannot promise that. The pilot compares a model with your current method on one product family so you can see the difference before deciding anything.
How long does a prototype take?
A focused prototype and adoption plan is typically three to five weeks after scope, access and users are confirmed.
Related services
Use AI and data work to support Operations, including Lean and OEE, or Supply Chain, including inventory and S&OP. Related standalone offers: the Landed-Cost & Tariff What-If Dashboard and the Supplier Traceability & Compliance Evidence Pack. You can also read how we work or browse all services. Try our free supply chain tools or book a free 30-minute call.
Free supply chain tools
Three quick calculators and a live news feed for supply chain and operations teams. Enter your own numbers, click the button and read the result. Everything runs in your browser; nothing you type is sent anywhere or stored.
These tools give estimates for planning only. They use simplified formulas and the figures you enter, so check important decisions against your own data and advisers.
Landed-cost calculator
See what an imported item really costs once freight, duty and fees are added to the ex-works price.
- Goods value (ex-works)
- Duty amount
- Total landed cost
- Landed cost per unit
- Landed vs ex-works uplift
Estimates for planning only. Results depend entirely on the numbers you enter and are not a quote, a customs ruling or professional advice.
Safety stock and reorder point calculator
Estimate how much buffer stock to hold and when to reorder, based on how much your demand and supplier lead time vary.
- Safety stock
- Safety stock, rounded up
- Demand during lead time
- Reorder point
- Reorder point, rounded up
Estimates for planning only. Results depend entirely on the numbers you enter and are not a quote, a customs ruling or professional advice.
Inventory carrying cost and turns calculator
Work out how quickly inventory turns, how many days of stock you hold, and what holding it costs each year.
- Inventory turns
- Days of inventory
- Annual carrying cost
Estimates for planning only. Results depend entirely on the numbers you enter and are not a quote, a customs ruling or professional advice.
Supply chain news tracker
Supply Chain Dive
SupplyChainBrain
FreightWaves
Headlines link to the original publishers.
Related guides: practical AI for small manufacturers' supply chains and supply chain data readiness checklist.
Start with the decision, not the dashboard
Bring a recurring report, a KPI question, a forecasting problem or an automation idea. We agree the scope with you before any work starts.